IoT Event Streaming Architecture
Internet of Things (IoT) and Event Streaming at Scale with Apache Kafka and MQTT.

With the boom in the number of IoT devices in recent years, relatively new use cases for IoT and sensor data, such as smart factories and smart cities, have led to time series data being produced on a large scale. In such use cases, a large number of different types of sensors send terabytes of data to be ingested, so that real-time monitoring can improve efficiency and avoid failures.
In this story I will show how we can deal the challenges of time series data and handle the high performance of such data at scale, using the Kafka Connect APIs for data ingestion and consolidation and the Kafka Streams API for aggregation and processing of data.
Main technologies of architecture
First of all, a brief review of the technologies applied in this architecture:
Eclipse Mosquitto
Eclipse Mosquitto is an open source (EPL/EDL licensed) message broker that implements the MQTT protocol. Mosquitto is lightweight and is suitable for use on all devices from low power single board computers to full servers.
The MQTT protocol provides a lightweight method of carrying out messaging using a publish/subscribe model. This makes it suitable for Internet of Things messaging such as with low power sensors or mobile devices such as phones, embedded computers or microcontrollers.
Apache ZooKeeper
ZooKeeper is a centralized service for maintaining configuration information, naming, providing distributed synchronization, and providing group services. All of these kinds of services are used in some form or another by distributed applications. Each time they are implemented there is a lot of work that goes into fixing the bugs and race conditions that are inevitable. Because of the difficulty of implementing these kinds of services, applications initially usually skimp on them, which make them brittle in the presence of change and difficult to manage. Even when done correctly, different implementations of these services lead to management complexity when the applications are deployed.
Apache Kafka
Apache Kafka is a distributed data transmission platform that allows you to publish, store and process log streams, and subscribe to them, in real time. It is designed to handle data streams from various sources and distribute them to various users. In short, it transfers huge amounts of data, not only from point A to point B, but also from point A to Z and anywhere else you need, all at the same time.
Apache Kafka is the alternative to a traditional business messaging system. It started as an internal system that LinkedIn developed to handle 1.4 billion messages per day. Now, it is an open source data transmission solution with applications for various business needs.
Apache Kafka Connect
Kafka Connect, an open source component of Apache Kafka, is a framework for connecting Kafka with external systems such as databases, key-value stores, search indexes, and file systems.
Kafka Connect is focused on streaming data to and from Kafka, making it simpler for you to write high quality, reliable, and high performance connector plugins. It also enables the framework to make guarantees that are difficult to achieve using other frameworks. Kafka Connect is an integral component of an ETL pipeline, when combined with Kafka and a stream processing framework.
Apache Kafka Streams
Kafka Streams is a client library for building applications and microservices, where the input and output data are stored in an Apache Kafka cluster. It combines the simplicity of writing and deploying standard Java and Scala applications on the client side with the benefits of Kafka’s server-side cluster technology.
Prometheus
Prometheus is a free software application used for event monitoring and alerting. It records real-time metrics in a time series database built using a HTTP pull model, with flexible queries and real-time alerting. The project is written in Go and licensed under the Apache 2 License
MongoDB
MongoDB is an open source, document oriented, NoSQL database system. Instead of storing data in tables, as is done in relational databases, MongoDB saves BSON data structures (a JSON-like specification) with a dynamic schema, making data integration in certain applications easier and faster. MongoDB is a database suitable for use in production and with multiple functionalities.
Grafana
Grafana is a free software based on the Apache 2.0. license that allows the display and formatting of metric data. It allows you to create dashboards and charts from multiple sources, including time series databases such as Prometheus, Graphite, InfluxDB. Originally started as a component of Kibana and later branched.

Architecture Overview
This example scenario creates a simple real-time data processing and ingestion pipeline proposal to ingest and process messages from IoT devices (generally sensors). IoT devices and sensors generate thousands and millions of messages (or events). By capturing and analyzing these messages, we can decipher valuable information and take appropriate actions.
The design patterns applied in this example are appropriate for various industries that use sensors to manage and monitor complex systems in industries such as smart buildings, communications, manufacturing, direct selling, and healthcare.
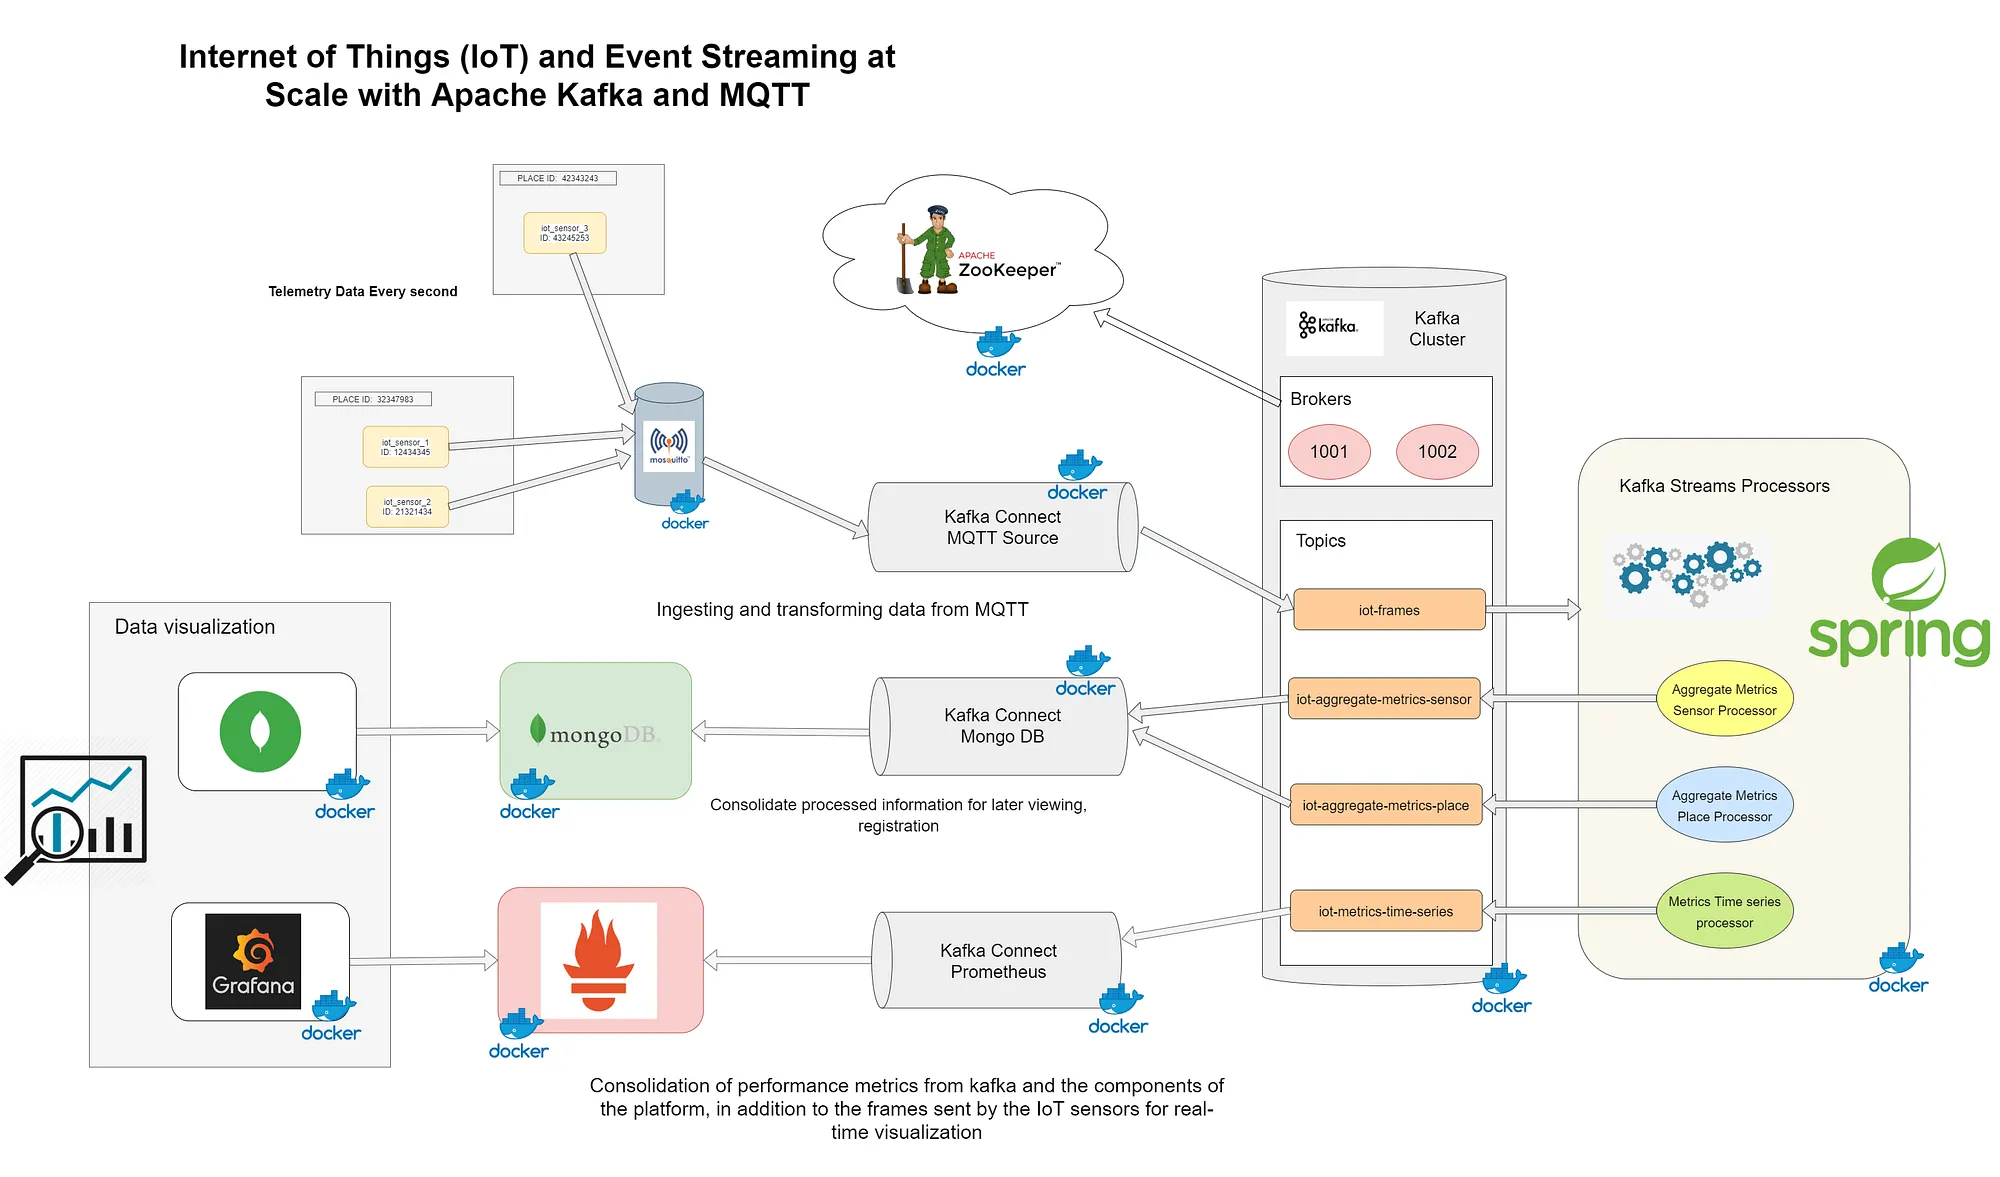
The objectives of this architecture are the following:
• Ingest and store real-time data from IoT sensors located in various locations.
• Analyze and make aggregations through rotating time windows to know average temperature by sensor or place, in addition to humidity, pressure and luminosity.
• Store data after processing for subsequent monitoring in a NOSQL database with good performance for frequent writes for relatively homogeneous document sizes such as MongoDB.
• Visualization of the metrics of the sensors in real time and of the performance of the components of the architecture through Grafana and the consolidated documents in MongoDB through Mongo-Express.
Next, I will explain in detail how I have implemented each of these steps with the necessary tools and configurations to achieve each goal.
Ingest and store real-time data from IoT sensors.
The IoT sensor layer has been simulated with microservices implemented in Spring Boot that, through the Eclipse Paho MQTT library, transmit the telemetry data to the Eclipse Mosquitto broker. This information is generated every second and the generated payload has the following scheme:
The sensor will be simulated with a Callable that will be executed by an environment task every second. This receives as environment variables the sensor name, id and the identifier of the place where it is located. It builds the payload with simulated data of temperature, humidity, pressure and luminosity, serializes it to JSON and transmits it to the MQTT topic through the configured client.
During the startup of the Kafka Connect container, the creation and configuration of the different connectors necessary to establish the communication flow between the different components that make up the platform will be carried out. Among them, we will have configured the mqtt-source connector that will establish the connection with the Mosquitto broker for the transmission of the frames to the Kafka topic iot-frames. This connector will use the sensor identifier present in the payload as the record key that will be sent to Kafka.
The official Confluent connector for MQTT is used and its configuration is expressed through a JSON document as can be seen below
The most important properties that I would like to highlight from the above settings:
· mqtt.topics: The MQTT topics to subscribe to.
· kafka.topic: The Apache Kafka topic to write the data to.
· mqtt.qos: The MQTT QOS level to subscribe to.
You can get more information on the official connector page
Through the Landoop Kafka Topic UI interface we will be able to view the result of the ingestion by the connector. The key will consist of a single property with the sensor identifier encoded in Base64 that we will use later to make groupings.

We already have the first goal completed, we have configured a connector that allows us to move the telemetry information from Mosquitto in an efficient and scalable way. For this architecture example, a single task has been configured for the connector (tasks.max = 1), it is possible to scale the connector by increasing the number of tasks.
Analyze and make aggregations.
We have the topic iot-frames with updated telemetry information from the sensors, the next step will be to process that information, making aggregations to get useful information.
In this architecture example, a iot-processor microservice has been developed that deploys a Kafka Streams application with three processors.
All the necessary configuration for the operation of the consumer, Kafka producer and the processing stream will be provided by this class.
The first processor called Aggregate Metrics By Sensor Processor will make an aggregation by sensor id applying a rotating time window of 5 minutes to determine the averages for temperature, humidity, pressure, luminosity …
The processor will produce a different schema model for which it will be necessary to configure the appropriate SerDe so that this information can be serialized and deserialized in Kafka.
When the window is closed, it generates a single record with about 300 aggregated measurements for each sensor and the calculated avg values.
This record will be stored in the topic iot-aggregate-metrics-by-sensor.
The second processor called Aggregate Metrics By Place Processor will make an aggregation similar to the first, but in this case, it will use the place identifier to determine averages by place rather than by sensor.
The model generated by this stream will have a different schema for which the appropriate SerDe is configured so that the record can be serialized in the topic iot-aggregate-metrics-place.
The latest processor will aim to transform information into a Prometheus-compatible data schema.
The name, sensor id and the identifier of the place will be used as dimensions of the information and the payload will be the values that can be represented in time series panels in Grafana.
These records will be stored in the topic iot-metrics-time-series, this topic will be polled by Prometheus to get these metrics.
Store data.
The main goal of this step will be to move the processed information from the Kafka topics to the respective MongoDB collections to later be able to view this information with Tools such as MongoDB-Express.
For this, three instances of the MongoDBSinkConnector have been configured, each one of them will work with a different topic from Kafka and will move its information to a collection in MongoDB.
The first configured connector will move all the original records from the iot-frames topic to the iot_frames collection into the iot database.
The connector will work with JSON without any schema defined like Avro or JSON-Schema to simplify the process.
The second connector will have the responsibility of moving the information processed in the iot-aggregate-metric-sensor topic to the iot_aggregate_metric_sensor collection.
Finally the last MongoDB connector will move the information aggregate by places present in the topic iot-aggregate-metric-place to the collection iot_aggreagate_metric_place.
The properties configured for the connector are self explanatory, it is not necessary to give more details. More advanced information can be found in the official connector documentation.
The other database that will need to be fed is Prometheus, it will be necessary to configure a connector that can move the information from the iot-metric-time-series topic to the database. Prometheus get the information through a data polling system, so this connector enables an HTTP server through which Prometheus can query the information.
The Kafka Connect Prometheus Metrics Sink Connector make this data available to an endpoint which is scraped by a Prometheus server. The connector accepts Struct and schemaless JSON as a Kafka record’s value.
The Prometheus connector has the following limitations:
- Timestamp not supported: Prometheus uses the timestamp when metrics are scraped. Timestamps in Kafka records are ignored.
- Pull-based Connector: Prometheus is a pull-based system. The connector starts an HTTP server on the worker node. All the metrics processed by the connector are made available at the worker HTTP endpoint. The endpoint is configured using the
prometheus.scrape.urlproperty. Theprometheus.scrape.urlHTTP endpoint must be added to theprometheus.ymlconfiguration file. - Metric types: Almost all metrics are interpreted as
gaugetype. An exception to this is thecountertype used for incrementing values. Examples of these types are provided in the following section. For more information, see Prometheus Metric Types. - Buffer limit: The connector buffers metrics from Kafka topics and makes them available when Prometheus scrapes the HTTP server endpoint. Buffer size is set at 3 million metric items to give Prometheus sufficient time to read and process metrics between consecutive scrapes.
More details about this connector can be found on the official connector page
Data Visualization.
We have reached the last step, so far we have achieved to move the telemetry information from the sensors to kafka, we have carried out a couple of simple processes on the data and we have consolidated that information in MongoDB collections and in a time series database in Prometheus, Now we will take a look at the Grafana and Mongo-Express tools to explore all this information in real time.
Grafana has compatibility with multiple time series databases as data sources, for this project the container will start with a pre-configured Prometheus data source a series of dashboards designed to explore metrics of the containers that make up the platform and the information of sensors.
In the following image we can see the dashboard built on the metrics of the sensors that allows us to visualize the average temperature of each sensor, humidity, pressure, luminosity …

On the other hand, the Mongo-Express tool will allow us to explore the collections of the IoT database that will store the results of the aggregations previously explained.

We will be able to view the detail of each document stored in the collection to consult the number of samples that have been used to calculate the avg results.

Used technology
In this section I will list all the libraries and tools used to develop the project
- Spring Boot 2.3.3 / Apache Maven 3.6.3.
- Spring Boot Starter Actuator.
- Kafka Streams.
- Spring Kafka.
- Micrometer Registry Prometheus.
- Eclipse Paho MQTT Client.
- Kafka Connect.
- Kafka Rest Proxy
- lombok.
- Jackson.
- NodeExporter (Exporter for machine metrics).
- Prometheus.
- Grafana.
- Eclipse Mosquitto.
- MongoDB.
- Mongo DB Express (Web-based MongoDB admin interface, written with Node.js and express).
- Cadvisor (Analyzes resource usage and performance characteristics of running containers).
- kafka-exporter (Kafka exporter for Prometheus).
This is it, I have really enjoyed developing and documenting this little project, thanks for reading it, I hope this is the first of many. If you are interested in see the complete code, here is the link to the public repository.